Do a Language Model's Expert Neurons Think Like a Human Brain?
Language models align with human brain activity during language processing, but why? Is it because every neuron contributes a little, or because a sparse set of “expert” neurons carries the semantics? For my Artificial and Biological Neural Systems project at Trento, I took the expert neurons out of GPT-2 and compared their representational geometry directly against fMRI recordings from nine people.
By Juan Camacho
The Question
Prior work on model-brain alignment mostly imposes the alignment: fit a linear map from model activations to brain activity, or prune features against human data until they match. Both assume brain-aligned structure has to be built by optimizing against human measurements.
Mechanistic interpretability suggests something more interesting: maybe that structure is already in the model. The ExpertLens line of work identifies expert neurons: sparse, concept-specific units whose overlap patterns reconstruct human similarity judgments with no transformation at all. Those experts were validated against behavioral judgments, though. Whether they match how the brain actually encodes those same concepts was untested.
So: do expert neurons align with fMRI better than the dense layer embeddings they’re drawn from?
Methodology
The core of the method is a search: every one of GPT-2’s 82,944 neurons is scored as a detector for one concept, and only the sharpest survive.
Finding the experts. The headline counts and the per-concept bars are measured from the run; the per-sub-layer density field and the ranking curve are illustrative, since the per-neuron AP arrays are not in the published artifacts.
Two parts of that picture deserve unpacking.
The pipeline around it is two branches meeting at the end: the 60 nouns from Mitchell et al. (2008) go through GPT-2 on one side and through nine people’s brains on the other, and Representational Similarity Analysis compares the two geometries.
Defining a concept by discrimination, not definition. Each of the 60 nouns gets 400 sentences that contain it and 1,000 that don’t, stratified over the other 59 concepts. Every neuron is then treated as a binary classifier for “is this concept present?”, and scored by Average Precision: the area under its precision-recall curve when sentences are ranked by activation. Neurons above a threshold are that concept’s experts. With AP ≥ 0.5, concepts average 819 experts out of 82,944 neurons, ranging from 224 (glass) to 2,018 (screwdriver).
Filtering redundant experts. This was my methodological addition. Some experts have near-identical activation profiles, so they inflate a concept’s apparent footprint. Naively dropping the weaker neuron of each correlated pair is order-dependent and misses transitivity: if A-B and B-C both correlate but A-C doesn’t, all three still belong together. Modelling it as a graph and taking connected components gives a deterministic grouping, from which I keep the single highest-AP representative. Redundancy turned out to be low: under 3% at a 0.8 correlation threshold, and 27 of 60 concepts had none at all at 0.9.
Experts Organise Concepts Like People Do
Before touching brain data, a sanity check: do expert sets reproduce human semantic categories? Measuring Jaccard overlap between concepts’ expert sets and laying them out by multidimensional scaling gives clear category structure.
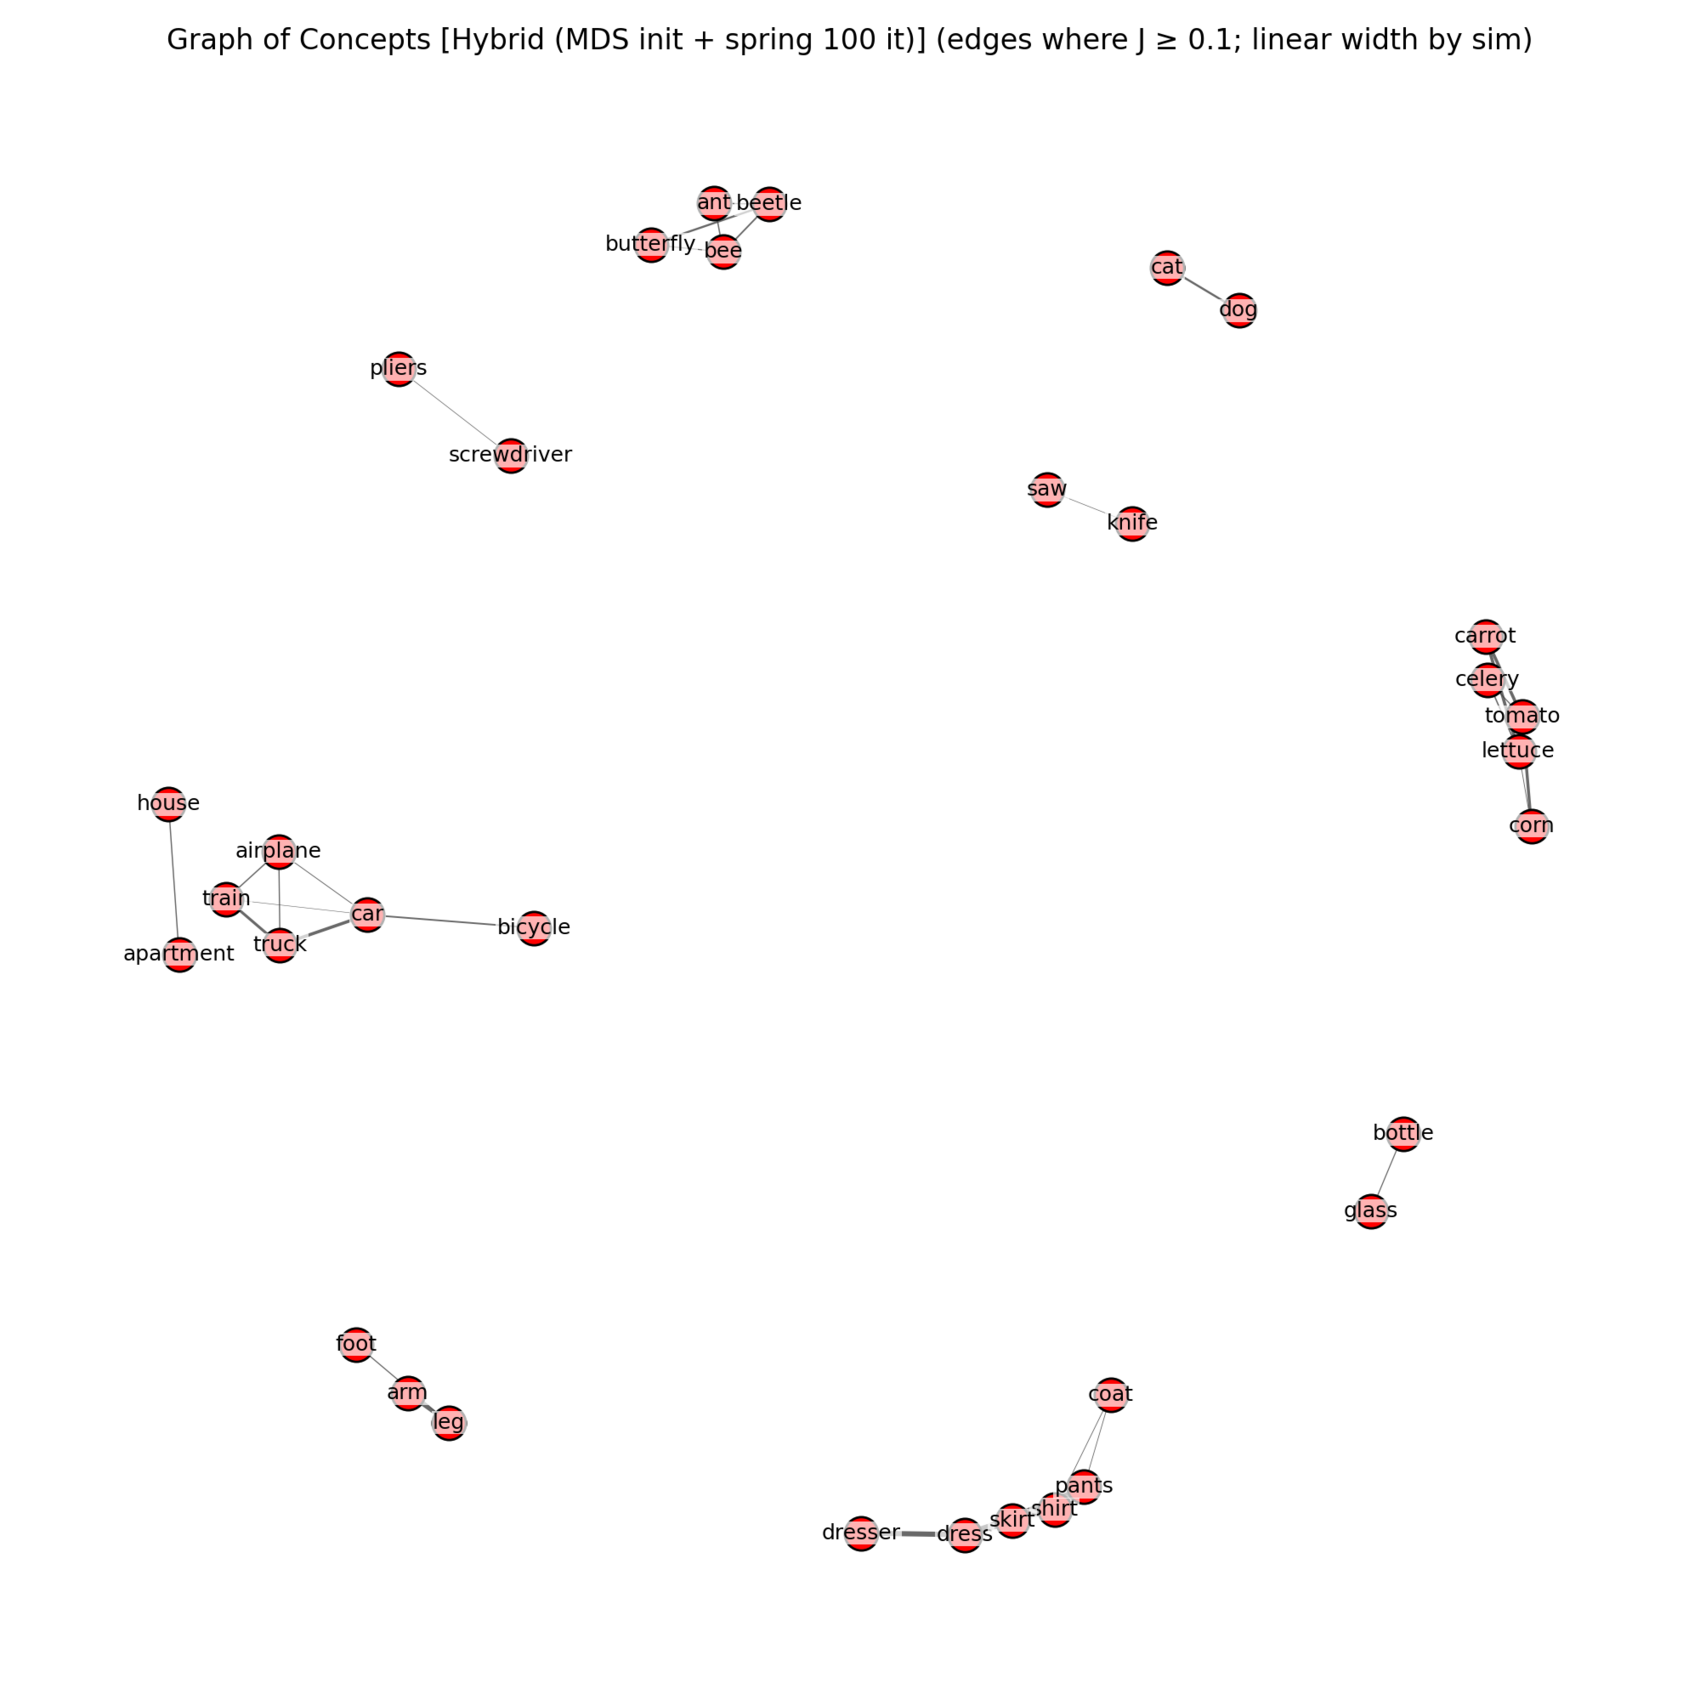 Concepts positioned by expert-set overlap. Clothing, vegetables, and vehicles form visible clusters without any supervision from human judgments.
The strongest pairs are exactly the ones you’d predict: dress-skirt (27.3%), lettuce-tomato (19.8%), arm-leg (18.3%), car-truck (16.8%). Clothing dominates the top five. Cross-category overlap is substantially lower.
The Brain Comparison
Now the actual question. For each of 87 valid brain regions and each GPT-2 sub-layer, I compared the expert RDM and the dense RDM against the brain RDM, then ran a paired t-test across the nine subjects.
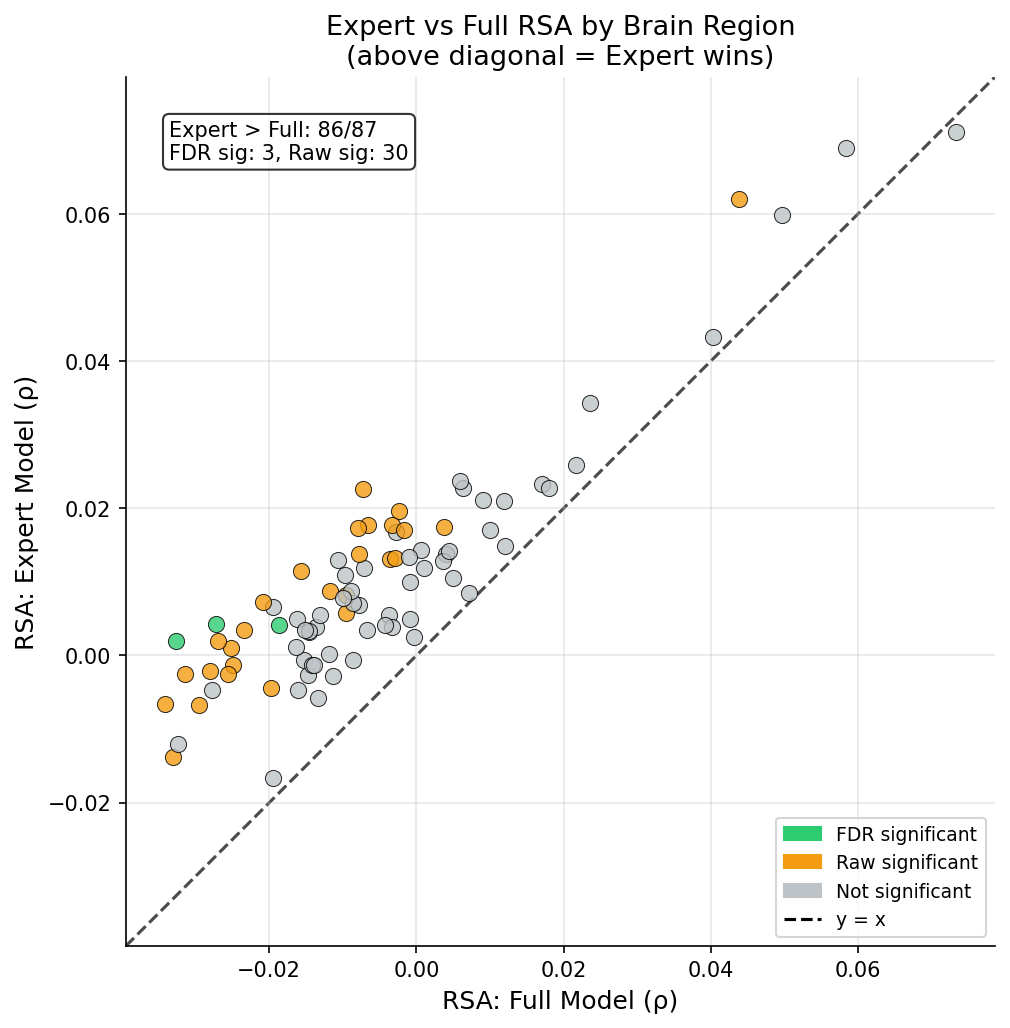 Each point is a brain region, for the best MLP condition. Points above the diagonal are regions where expert neurons beat the dense embedding.
Expert neurons do align better than dense embeddings, modestly, and not everywhere. The MLP projection layer is the standout: at AP ≥ 0.6 it reaches a mean effect size of d = 0.627 over the dense baseline, with 30 regions significant before correction and 3 surviving FDR. Attention layers help too, but need stricter filtering (best at AP ≥ 0.7, d = 0.536).
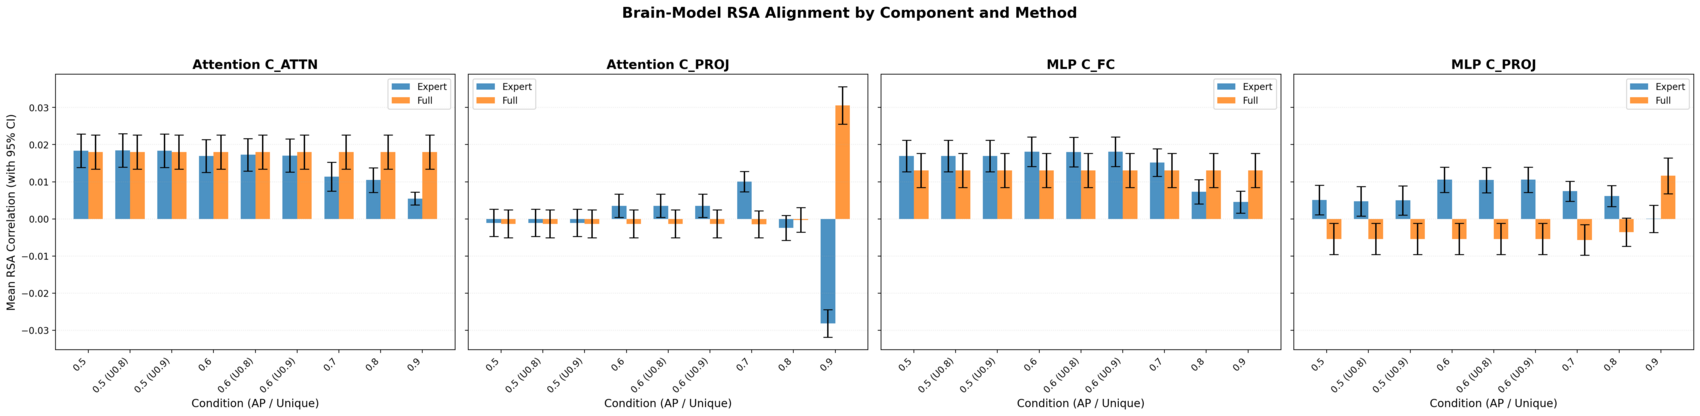 Alignment across all four sub-layer types. MLP components carry more brain-aligned semantic signal than attention.
Two findings I didn’t expect:
Where the effect is largest isn’t where correlation is highest. Experts in mlp.c_proj correlate slightly worse with brain data than those in mlp.c_fc (ρ = 0.011 vs 0.017), yet show a much bigger advantage over dense (d = 0.627 vs 0.443). The reason is that the dense projection layer aligns poorly on its own (ρ = -0.005), so the expert signal stands out against a weaker baseline. The MLP output bottleneck concentrates semantics that the full layer dilutes.
More selective is not better. Push the AP threshold to 0.9 and alignment collapses, dramatically for attention (d = -0.929), where experts end up worse than dense. Extreme selectivity leaves too few neurons to describe a concept’s geometry.
Being Honest About the Numbers
The raw correlations are small (mean ρ ≈ 0.01) and most regions don’t survive FDR correction across 87 comparisons. This is preliminary evidence, not a settled result. What holds up is the direction: the effect sizes are consistently positive for the best-performing layers, and consistent across subjects. Sparse, interpretable features appear to capture something of how the brain organises semantics, which is a claim worth testing at larger scale, with better-powered statistics and per-voxel normalisation.
Takeaways
- Expert neurons align with fMRI representational geometry better than the dense embeddings containing them, in the layers where semantics concentrate.
- MLP sub-layers carry more brain-aligned signal than attention, and the MLP output projection shows the largest gain over its dense baseline.
- Selectivity has a sweet spot: moderate AP thresholds (0.5-0.7) work; very strict ones destroy the geometry.
- Expert redundancy in GPT-2 is low, so unique-expert filtering is a small correction here; it may matter more in larger models.
Code is at experts-ml-selfcond, and the generated sentence dataset is on Hugging Face.